Stellar Coronae
Andrew Cameron and Jean Francois Donati
take the Zeeman-Doppler images of cool star coronae.
They ship the ZDI maps to Moira Jardine who calculates
the magnetic field and plasma density. Moira gives the density grids
to me and I calculate what the corona would look like using 3D Monte
Carlo radiation transfer codes. Below
is an example showing the cool spots on the surface of AB Doradus
(sizes, temperatures, and locations determined from the ZDI images)
overlaid with the coronal emission calculated
from the Monte Carlo codes. For more details of this research, see
Moira Jardine's web page.
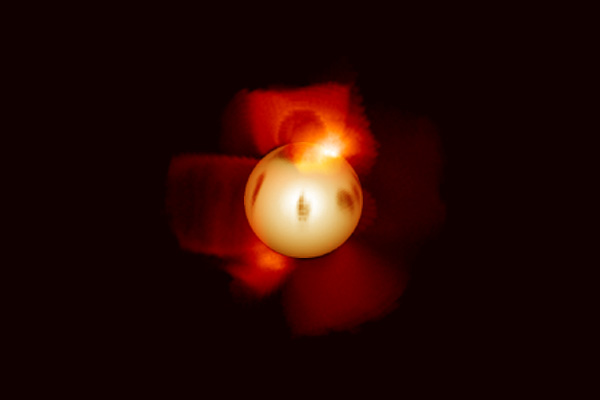
Model X-ray emission from the million-degree plasma
trapped in the closed field regions of the corona of AB Dor.
At the moment we assume that the coronae
are optically thin, so the X-ray images could be calculated by direct line of
sight integration through the coronal density/emissivity grid.
We're using the Monte Carlo codes for the radiation transfer because
we will eventually be extending the models
to include optically thick lines and investigate the effects on coronal
images and line ratios. Some preliminary models of resonant line images
of optically thick coronal loops are presented in
Wood & Raymond (2000).
The image above shows the derived X-Ray image for AB Dor. We cannot
resolve AB Dor to see this structure, but we can resolve the X-Ray
emission for the Sun. Applying the same techniques to solar magnetograms
gives a model for solar X-Ray emission. Here's some movies showing
this...
 Left: AB Dor,
Right: AB Dor + Dipole Field
Left: AB Dor,
Right: AB Dor + Dipole Field
 Left: Solar Maximum,
Right: Solar Minimum
Left: Solar Maximum,
Right: Solar Minimum